Slow things usually just turn out slow when they reach production. The worse scenario arises when a specific combination (often involving lots of data) occurs, and it is hard to simulate it on stage environments. Once you rule out obvious mistakes, the best way out the sluggishness is to monitor how your application is performing through new versions. This way you can identify slow components and treat them accordingly. This article is about how you can store performance data about your REST application using AWS CloudWatch and visualize it with Grafana.
About Telemetry
Telemetry is about measuring. It is to observe the behavior of a subject using a set of proxy metrics. It means we usually agree that a given metric is a good way to observe what we want. Good metrics have some specific traits, such as being comparative, sensitive enough and having enough data to keep tracking it. On this article the goal is to tackle on specific metric for performance, very common on RESTful APIs: the duration of a request. How much time do you your application need to come receive a given request, process it and return the desired response? This is a good metric because it is easy to understand and covers what the users really care about. This downside is its kind of broad, since you don’t know who’s the main responsible for that delay: some ill written code? network delay between code and your database? Your database query?
That’s why you should look for more metrics, specially designed for the context you are working on. But you can use the same concept shown here, incrementally increasing what you observe. With response time, you can have a good clue about what is happening. Then you know where to put your maintenance effort and go further in order to find the root cause.
Gathering Data
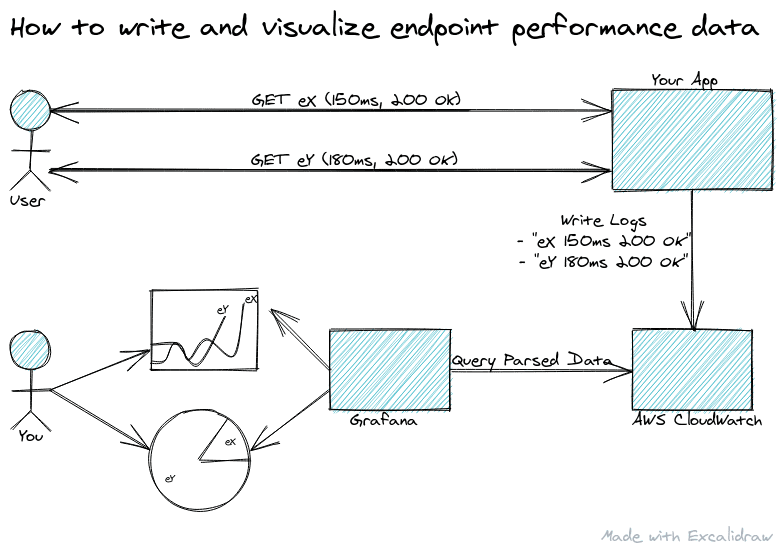
The architecture here is not very complex. After you measured the endpoint execution time (more on that latter), you must send the result as a known formatted log entry for CloudWatch Logs. When the data is there you can use the CloudWatch Logs Insights to write a query that parses the data and then aggregates it. This diagram shows how it works:
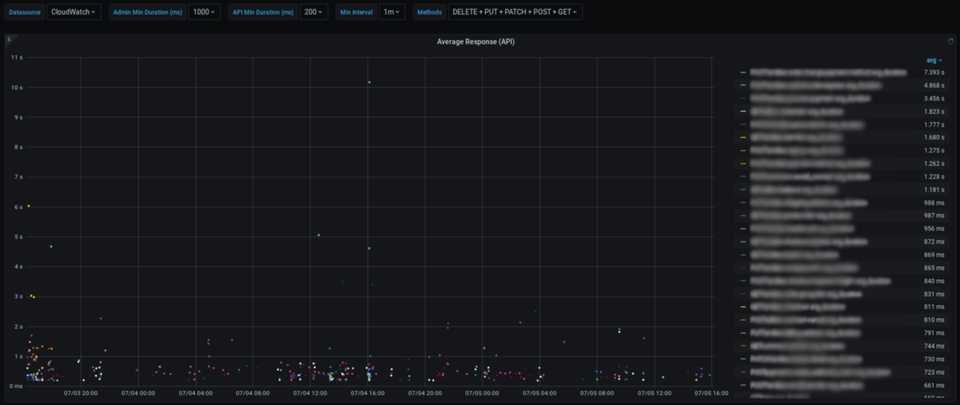
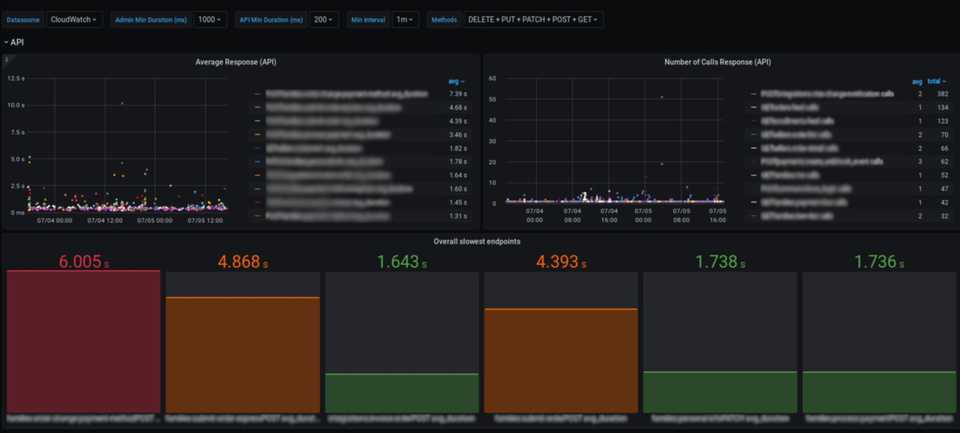
To observe how the results evolve you can use the native Grafana CloudWatch Datasource, and have neat visualizations like that (click to enlarge):
You can see I’ve created some filters to have cleaner visualizations, like ruling out some HTTP methods (like OPTIONS and HEAD) and fast requests (less than 200 milliseconds). You can use it to ignore specific endpoints, status codes and much more.
The first step is to produce the desired data. This can be done so many different ways, and I don’t wanna make this article about an specific stack. With Python and Django, you can write a lightweight middleware like:
import logging

from django.http import HttpRequest
from django.utils.timezone import now

def log_requests(get_response):
   logger_name = "profiler"
   logger = logging.getLogger(logger_name)

   def middleware(request: HttpRequest):
       before = now()

       response = get_response(request)

       after = now()
       duration = (after - before).total_seconds() * 1000  # milliseconds
       if request.resolver_match:
           uri = request.resolver_match.view_name
       else:
           uri = request.path
       status_code = response.status_code
       method = request.method
       logger.info(f"[{logger_name}] {method} {uri} {duration:.2f} {status_code}")
       return response
   return middleware
It is easy to do the same using pure Go and Flask too. The point is to get the time as broad as possible, so you can be sure the data is about your entire code execution. Also, pay attention to your the format you are writing your logs. You must be sure you’ll be able to parse it using regular expressions so you can aggregate the data, getting number the of calls or the average response.
After you have the information, how does it get on CloudWatch? There are many solutions, and again I want to be agnostic. So there are a few for you to consider depending on your stack:
Watchtower (Python)
Watchtower is a project that uses Boto3 for sending Python logs to CloudWatch. It is easy as running aws configure and:
import watchtower, logging
logging.basicConfig(level=logging.INFO)
logger = logging.getLogger(__name__)
logger.addHandler(watchtower.CloudWatchLogHandler())
logger.info("Hi")
logger.info(dict(foo="bar", details={}))
You will find simple examples for Flask and Django
AWS Lambda
If you are using AWS Lambda for a serverless architecture You won’t need to worry about sending data to CloudWatch. By default you can just log the data to stdout and it will already be available on CloudWatch Logs.
AWS API
You can go raw and use AWS API. You don’t need to worry about having specific SDKs if you don’t want to, although they make the integration seamlessly.
Working with CloudWatch Logs
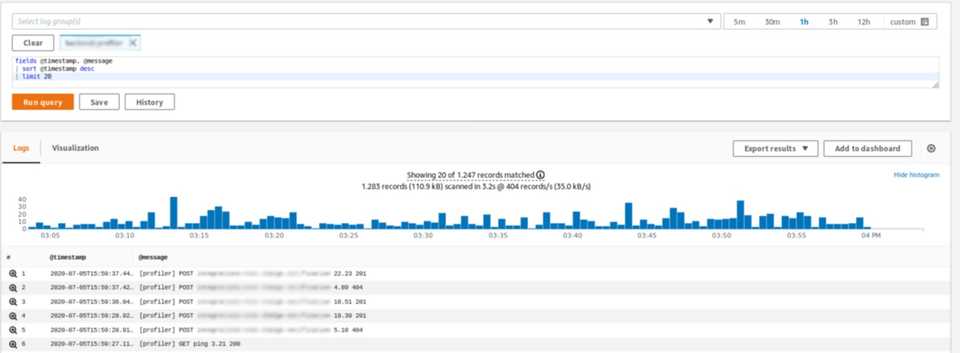
Now the data is there, you can read (and even add some visualizations) with CloudWatch Logs Insights. The first thing you can see will be something like:
So you just need to write a query, using the PARSE and the STATS command. something like that would work with this log format:
@message
| PARSE @message "[*] * * * *" as logger, method, view, duration, status_code
| STATS avg(duration) as avg_duration by method, view, status_code, bin(30s)
Grafana
Grafana is an open source for data visualization and observability. It is compatible with many different data sources, including CloudWatch. Basically, you can just copy the same query you executed before on CloudWatch Logs Insights and paste it on a Grafana Panel and voilà! You can follow how things are going with your API.
Getting more data
As you can see, this is just the tip of iceberg: how many metrics can work in this model? Some ideas I am working on:
- Response size (Kb): some endpoints are not slow on processing, they are just handling too much data at once. You can use this metric to find endpoints that could be better filtered and paginated, as well as other problems as unnecessary mobile data consuming.
- Number of database queries: when you have a slow endpoint, it is usually ORM’s fault. More precisely, someone made a mess writing mappings or consuming data, so you the endpoint is not using the resources smartly. This metric is good not just to find slow endpoints, but to find those that will be in the right conditions. Making too many queries is usually a bad sign, and you can detect problems before they grow.
- Query time execution: when you spend too much time running queries, it might be a sign that they are ill designed or you need review your indexes. It is also a easy metric to spot more specific problems so you can start your detailed profiling from somewhere.
- External calls execution: you usually expect that external API calls will add a overhead on your endpoint, so slower results aren’t a surprise. But they can be way slower, specially on specific hours or days. This kind of metric can help you redesign your application to add asynchronous behaviors and more.
Conclusion
Monitoring is the only way to know if your application is doing OK out there. Some use cases urge for metrics related to security, resiliency and availability, such as status checks, error logs and access logs. Those are important, but knowing how your application is performing on real scenarios can give you deep insights on how your users are experiencing your service. A well designed, continuous and incremental telemetry solution can give you a heads up before you start reaching timeouts. Tools like Grafana and CloudWatch are here to help.


